This easy-to-use application gives you daily and quarterly earnings, statements and analytics. It simplifies your financials and delivers them to your pocket.
Analytics on call
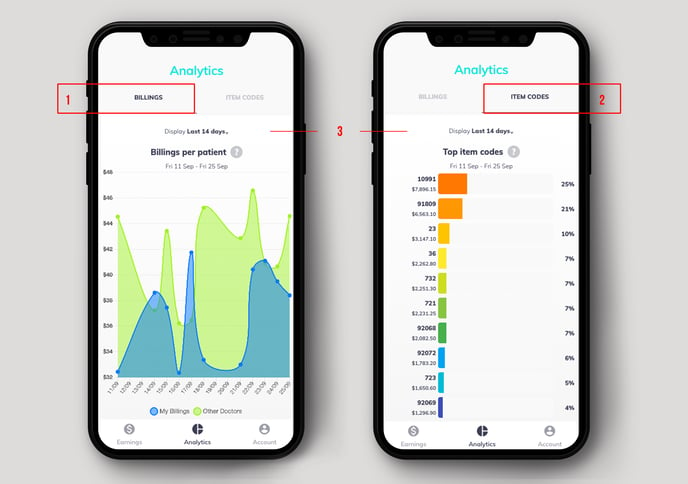
Tapping the second icon on the menu bar takes you to the Analytics screen.
This screen displays two default graphs:
- Billings per patient shows your Doctor earnings against all Doctors in the same clinic for the same period. Hovering over plotted data points reveals their value.
- Item codes billed shows a bar graph of all item codes billed for the selected period.
Adjust the time period to 14 days, 3 months, or the past 12 months.